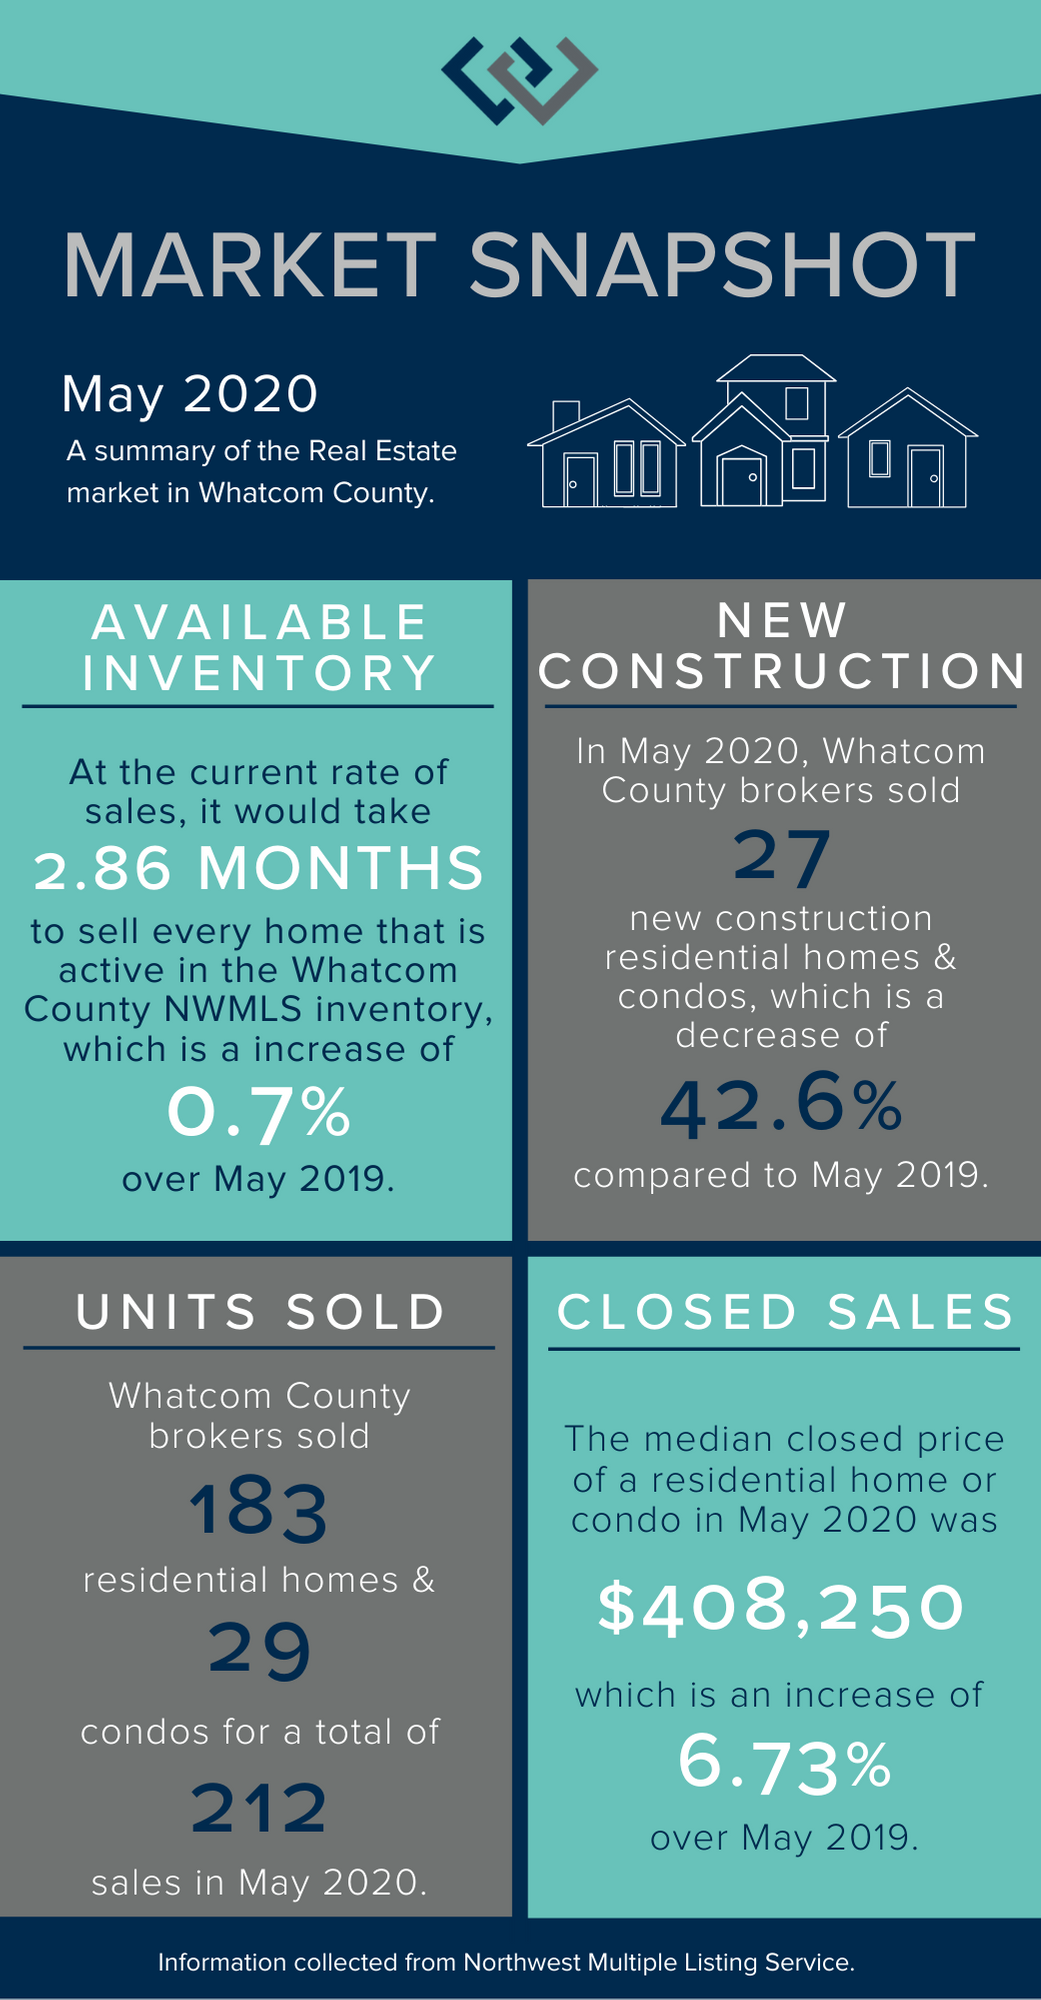
I look forward to presenting this infographic to you on a monthly basis moving forward. It gives you an easy way to digest changes year over year, and compare month to month if you look back at previous month’s snapshots. I was surprised to see that the Available Inventory Ratio increased this year over last year. What was not a surprise was the almost 50% reduction in New Construction sales year over year. When New Construction stopped due to Covid, all the homes in the process of being built came to a screeching halt. Hopefully we will see this percent increase over the next few months as builders are catching up on delayed construction.
Most note-able is the INCREASE in closed sales price as we gathered from the infographic above, There was a 6% increase in home value from May 2019 to May 2020!
For those of you that were convinced that Covid-19 would have an affect on the Real Estate Market- are you surprised?! |
