Welcome to June! It was announced today that the Washington State Secretary of Health has accepted Whatcom County’s application to move on to Phase 2 of the Washington’s Safe Start Plan. You can read a broad explanation of what that means here, and here are a few key changes:
Lets you have 5 people inside household
Restaurants can open to 50% capacity (with no bar seating)
Real Estate, Nail Salons, and Barbers can open
I will also explain below what that means specifically for my business and the real estate world.
BACK TO THE DATA
New Listings for both 2019 and 2020 increased over the last week: This is typical, healthy trend as we get further into a spring market!
115 → 133 in 2019
69 → 86 in 2020
UNDER CONTRACT
Below is an accounting of all of the active listings on the market in our three major markets along with all of the sales that went under contract from 5/30 to 6/5/20 (pulled around Noon PST) and the percentage relationship between those numbers.
Numbers are still hovering around the same general areas. If I had to guess I would see we will see our Under Contract Sales % creep up as everyone gets more comfortable moving into phase 2!
ADOM
The second chart represents the Average Days on Market (ADOM) for the homes that are currently active and that went under contract between 5/30/20 and 6/5/20. “Days on Market” is how long the home was active on the market before the seller accepted an offer.
As in a normal market there’s some fluctuation week-to-week in the DOM for the under contract sales. It will be interesting to see if the Difference in Days changes at all as we move into Phase 2!
% PRICE DIFFERENCE
The last set of data below is the average prices of the active listings and the average prices of the homes that went under contract last week. What we are mostly paying attention to here is how the % difference is changing from week to week to see how COVID-19 might be affecting the offer price that homes receive.
Yet again, Lynden is having homes go under contract that are priced higher than the average priced active home in the area. Bellingham had some lower priced homes go under contract this week that brought an 11% change!
In light of the massive increase of unemployment due to COVID-19, the guidelines for obtaining a home loan are changing regularly. If you are back-to-work and are looking to get pre-approved for a home loan, check in with your lender well ahead of time to be sure you can provide the proper income documentation. Lenders may be asking for a certain number of pay stubs showing back-to-work income before being able to pre-approve the buyer. Another area of concern for lenders is mortgage deferment. If you are looking to buy a home in the near future and your mortgage is in forbearance, there are specific requirements to meet before being able to buy. The bottom line is to check in with your lender today to be sure you understand the current guidelines that apply to you. If you don’t have a trusted lender, I would be honored to help you!
After being cooped up for so long, no doubt you have noticed things around your home that you would like to fix or upgrade. Many contractors are slowly getting back to work after weeks of not being able to, and I have had clients asking for referrals of those I trust for the work. My Vendors page on my website has a list to all my trusted contractors.
BACK TO THE DATA
While the number of New Listings in 2019 remained the same over the last 2 weeks at 115, the number of New Listings over the last week this year increase by 13.
UNDER CONTRACT
Below is an accounting of all of the active listings on the market in our three major markets along with all of the sales that went under contract from 5/23 to 5/29/20 (pulled around Noon PST) and the percentage relationship between those numbers.
Minor fluctuations again. The biggest to note this week is Bellingham, which saw an increase of 10 new Active Listings, and dropped from 40 to 25 homes Under Contract.
ADOM
The second chart represents the Average Days on Market (ADOM) for the homes that are currently active and that went under contract between 5/23/20 and 5/29/20. “Days on Market” is how long the home was active on the market before the seller accepted an offer.
AGAIN- Actives in all 3 areas continue to stay at a pretty steady DOM number over the weeks. As in a normal market there’s some fluctuation week-to-week in the DOM for the under contract sales.
% PRICE DIFFERENCE
The last set of data below is the average prices of the active listings and the average prices of the homes that went under contract last week. What we are mostly paying attention to here is how the % difference is changing from week to week to see how COVID-19 might be affecting the offer price that homes receive.
Lynden made a come back this week with higher than average price homes going pending.
This week, officials announced that the closure for non-essential travel over the border crossing to Canada has been extended until the end of June. So, we will have to wait a little longer for any fun rendezvous up north. I am curious to pay attention to how many of our Canadian buyers and sellers are unable to participate in our market right now as well. Also new this week, Skagit County Community College is providing drive-thru testing for COVID-19.
BACK TO THE DATA
Comparing this last week to the same week last year, we are again just under half the amount of New Listings for Whatcom County. The market continues to fluctuate normally week to week- the numbers for both years went down since my update last week; reported last week was 137 in 2019, and 65 in 2020.
UNDER CONTRACT
Below is an accounting of all of the active listings on the market in our three major markets along with all of the sales that went under contract from 5/9 to 5/15/20 (pulled around Noon PST) and the percentage relationship between those numbers.
The biggest changes here are that in Bellingham, the homes under contract DOUBLED (BIG WEEK BELLINGHAM!!!), and in Lynden, only 1 house went under contract in the last week.
ADOM
The second chart represents the Average Days on Market (ADOM) for the homes that are currently active and that went under contract between 5/9/20 and 5/15/20. “Days on Market” is how long the home was active on the market before the seller accepted an offer.
Actives in all 3 areas continue to stay at a pretty steady DOM number over the weeks. As in a normal market there’s some fluctuation week-to-week in the DOM for the under contract sales.
% PRICE DIFFERENCE
The last set of data below is the average prices of the active listings and the average prices of the homes that went under contract last week. What we are mostly paying attention to here is how the % difference is changing from week to week to see how COVID-19 might be affecting the offer price that homes receive.
WOW= that 1 house that went under contract in Lynden this last week brought the average down, and the % difference up substantially!
Our new normal seems to be becoming less new and more normal, just in time for our Phase 1 to be coming to an end- maybe one more week (at the earliest), and then we move on to Phase 2!
It’s still not business as usual – no open houses, only serious homebuyers touring, all showings by appointment only regardless of occupancy (vacant or occupied), showings limited to two people on a property (broker and client) with proper social distancing, and most everyone is sporting a mask.
*All of the agents at Windermere continue to protect our community through taking extra precautions to safely do business with us! We are wearing masks, gloves, and making sure to wipe down every surface we come in contact with!*
BACK TO THE DATA
Comparing this last week to the same week last year, we are just under half the amount of New Listings for Whatcom County. Considering everything going on this year, 65 in a week is not terrible.
UNDER CONTRACT
Below is an accounting of all of the active listings on the market in our three major markets along with all of the sales that went under contract from 5/9 to 5/15/20 (pulled around Noon PST) and the percentage relationship between those numbers.
The numbers for New Listings in all areas have only fluctuated a little bit since last week. How many weeks in a row have I been saying that? Small fluctuations are normal, and even though our total number of listings are less that what they would normally be, the market is fairly STEADY (in this the new normal?).
ADOM
The second chart represents the Average Days on Market (ADOM) for the homes that are currently active and that went under contract between 5/9/20 and 5/15/20. “Days on Market” is how long the home was active on the market before the seller accepted an offer.
If we look at the 3rd column, the higher the difference in days there is shows us that the homes that are under contract, have been on the market for a shorter time than the homes that haven’t accepted an offer. They might be priced too high, or not going pending for any number of reasons.
% PRICE DIFFERENCE
The last set of data below is the average prices of the active listings and the average prices of the homes that went under contract last week. What we are mostly paying attention to here is how the % difference is changing from week to week to see how COVID-19 might be affecting the offer price that homes receive.
Bellingham’s Under Contract Average price sure did change this week- a $1.9 million home pended! That sure changes the numbers! Lynden finally had homes go under contract that are priced less than the average for actives.
On this week’s episode of “Monday’s with Matthew,” Matthew Gardner discusses mortgage forbearance and whether it will help or hurt the US housing market and what you should take into consideration if you are deciding whether or not it is an option for you!
I hosted my very first Virtual Open House this weekend- what a fun way to show potential buyers and home lovers a home without spreading germs! I hope you were able to join me live on Facebook from the comfort of your own home! If not, the recorded video is posted on my feed in facebook and on IG TV! But don’t worry- that was the first, but it won’t be the last!
It’s still not business as usual – no open houses, only serious homebuyers touring, all showings by appointment only regardless of occupancy (vacant or occupied), showings limited to two people on a property (broker and client) with proper social distancing, and most everyone is sporting a mask.
*All of the agents at Windermere continue to protect our community through taking extra precautions to safely do business with us! We are wearing masks, gloves, and making sure to wipe down every surface we come in contact with!*
BACK TO THE DATA
Last week the number we reported was 57 New Listings for 2020 on the Market in Whatcom county. As you can see, the spring Market here is still coming along with 72 New Listings this week! Compared to 102 last year, we are still not up to our regular numbers, but we are not far behind.
UNDER CONTRACT
Below is an accounting of all of the active listings on the market in our three major markets along with all of the sales that went under contract from 5/2 to 5/8/20 (pulled around Noon PST) and the percentage relationship between those numbers.
The numbers for New Listings in all areas have only fluctuated a little bit since last week. Under Contract listings went up by a few in Bellingham and down just a few in Ferndale and Lynden. All normal fluctuations from week to week.
ADOM
The second chart represents the Average Days on Market (ADOM) for the homes that are currently active and that went under contract between 5/2/20 and 5/8/20. “Days on Market” is how long the home was active on the market before the seller accepted an offer.
Homes are continuing to sell fast, as all the numbers have dropped here from last week in almost every section! In Ferndale, the difference in days last week was 47, and the in Lynden, the difference was -36!
% PRICE DIFFERENCE
The last set of data below is the average prices of the active listings and the average prices of the homes that went under contract last week. What we are mostly paying attention to here is how the % difference is changing from week to week to see how COVID-19 might be affecting the offer price that homes receive.
Lynden is still having homes go under contract that are priced higher than the average Active Listing in that area and Bellingham and Ferndale are still hovering right about the same Price for pendings.
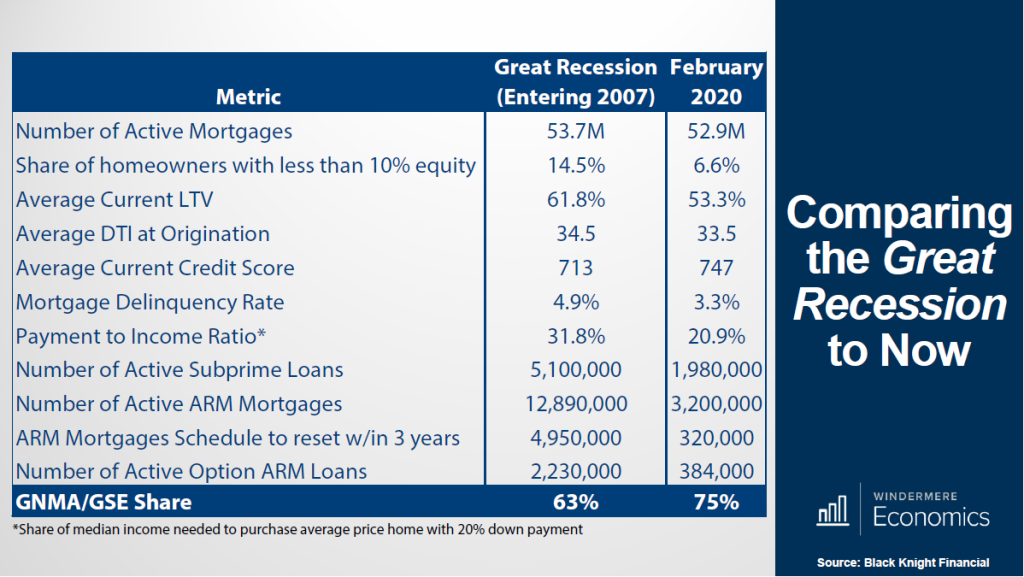
At Windermere, we have continued to rely on the expertise of Matthew Gardner, Windermere’s Chief Economist. This week Matthew addressed the growing concern that housing market is heading towards a repeat of the 2008 meltdown. He uses data to explains how we are in a very different place than when the housing bubble burst. Here is a chart he shared from Black Knight Financial comparing the housing market as we headed into this global health crisis versus the start of the Great Recession in 2007. Matthew predicted the Great Recession, so I think he knows a thing or two!
Bottom line, we are heading into this economic challenge with a much stronger foundation based on more stringent lending practices and higher equity levels. In fact, we have seen pending sales rise over the last three consecutive weeks, some even with multiple offers. Every neighborhood and every price-point has its own story.
As your trusted Real Estate advisor, I take great pride when it comes to your investment in the housing market and protecting the value of your home. Please reach out with any questions or concerns. It is my goal to help keep you informed and empower strong decisions.
On that note, it’s still not business as usual – no open houses, only serious homebuyers touring, all showings by appointment only regardless of occupancy (vacant or occupied), showings limited to two people on a property (broker and client) with proper social distancing, and most everyone is sporting a mask.
BACK TO THE DATA
April 25-May 1, 2019 had a big jump in homes on the market! 30 more homes last year, while this year is still staying pretty steady right around 60. As I said last week, with an exceptions of this year, it’s pretty typical to see Active homes increase on a weekly basis in the spring.
UNDER CONTRACT
Below is an accounting of all of the active listings on the market in our three major markets along with all of the sales that went under contract from 4/18/20 to 4/24/20 (pulled around Noon PST) and the percentage relationship between those numbers.
The number for Under Contract homes in Lynden dropped by half over the last week!
ADOM
The second chart represents the Average Days on Market (ADOM) for the homes that are currently active and that went under contract between 4/18/20 and 4/24/20. “Days on Market” is how long the home was active on the market before the seller accepted an offer.
Lynden again is the note-able one: pended some homes this week that have been on the market for a while- 134, 242, and 314 days, to be exact! That’s why the number for is almost 4 times higher than last week for ADOM in Lynden!
% PRICE DIFFERENCE
The last set of data below is the average prices of the active listings and the average prices of the homes that went under contract last week. What we are mostly paying attention to here is how the % difference is changing from week to week to see how COVID-19 might be affecting the offer price that homes receive.
Bellingham and Ferndale in each category are not far off from the week before, but we’re looking at you, Lynden. With two houses pending over $700k, your percent difference is up 59%!

 Facebook
 X
X
 Pinterest
 Copy Link


 In light of the massive increase of unemployment due to COVID-19, the guidelines for obtaining a home loan are changing regularly. If you are back-to-work and are looking to get pre-approved for a home loan, check in with your lender well ahead of time to be sure you can provide the proper income documentation. Lenders may be asking for a certain number of pay stubs showing back-to-work income before being able to pre-approve the buyer. Another area of concern for lenders is mortgage deferment. If you are looking to buy a home in the near future and your mortgage is in forbearance, there are specific requirements to meet before being able to buy. The bottom line is to check in with your lender today to be sure you understand the current guidelines that apply to you. If you don’t have a trusted lender, I would be honored to help you!
 In light of the massive increase of unemployment due to COVID-19, the guidelines for obtaining a home loan are changing regularly. If you are back-to-work and are looking to get pre-approved for a home loan, check in with your lender well ahead of time to be sure you can provide the proper income documentation. Lenders may be asking for a certain number of pay stubs showing back-to-work income before being able to pre-approve the buyer. Another area of concern for lenders is mortgage deferment. If you are looking to buy a home in the near future and your mortgage is in forbearance, there are specific requirements to meet before being able to buy. The bottom line is to check in with your lender today to be sure you understand the current guidelines that apply to you. If you don’t have a trusted lender, I would be honored to help you!